Premium reports
Moove Premium comes with some extra and special reports for you.
To access these settings go to Site administration > Reports.
Graphic reports
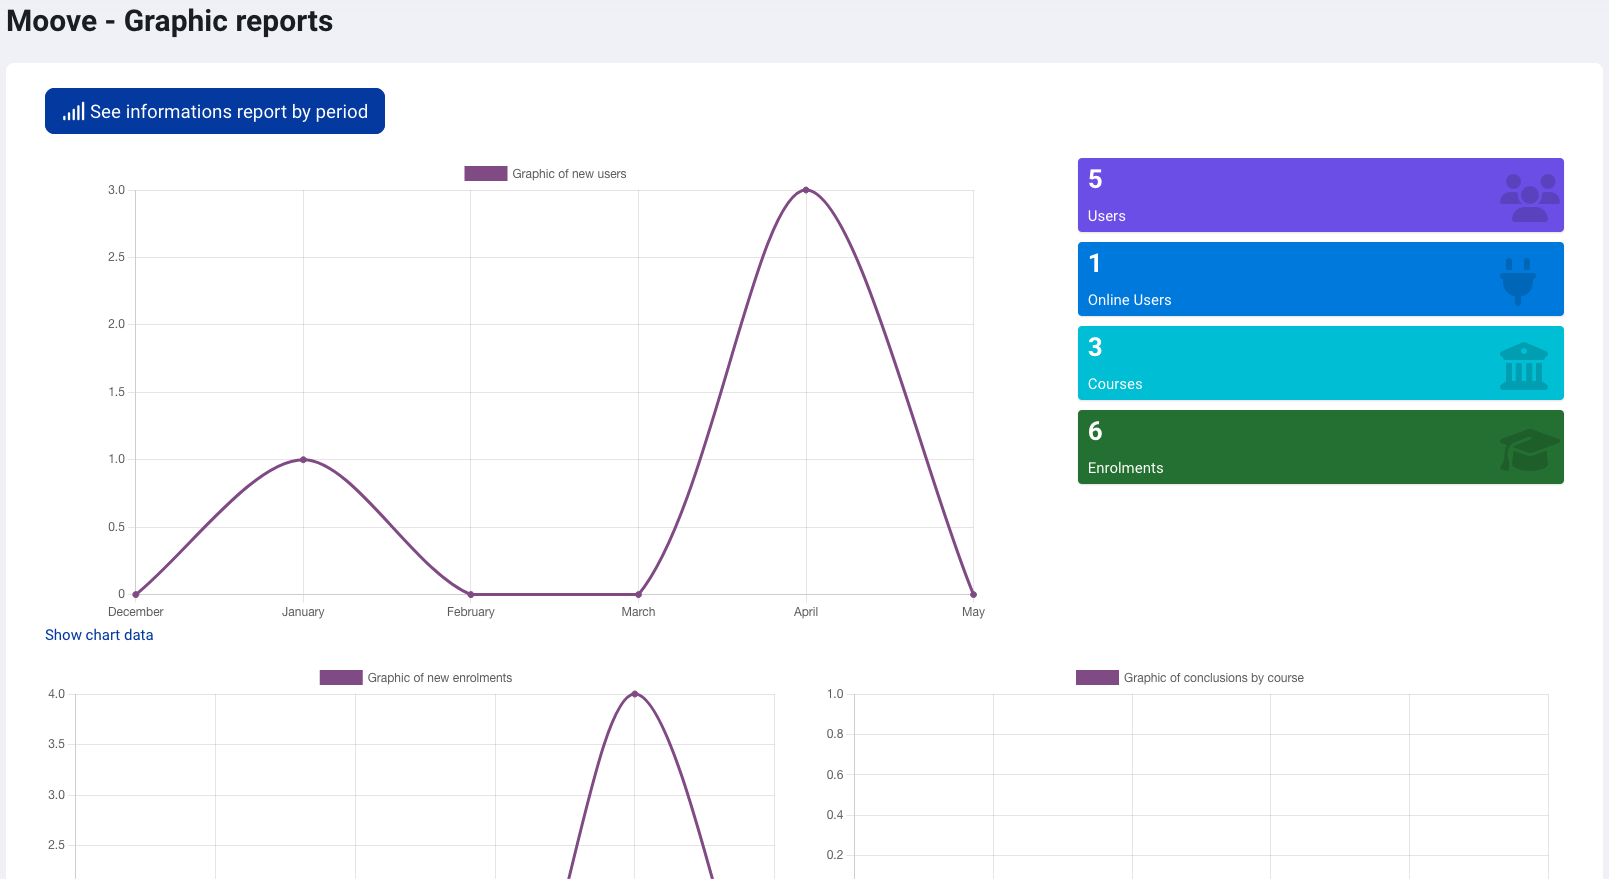
In this report page, you can see a mix of graphic and numeric data.
Graphics are:
- New users in the platform over the last 6 months.
- New enrolments in courses over the last 6 months.
- Course completions over the last 6 months.
Numeric data:
- Total users on the platform
- Online users
- Total courses on the platform
- Total courses enrolments
Numeric report by period
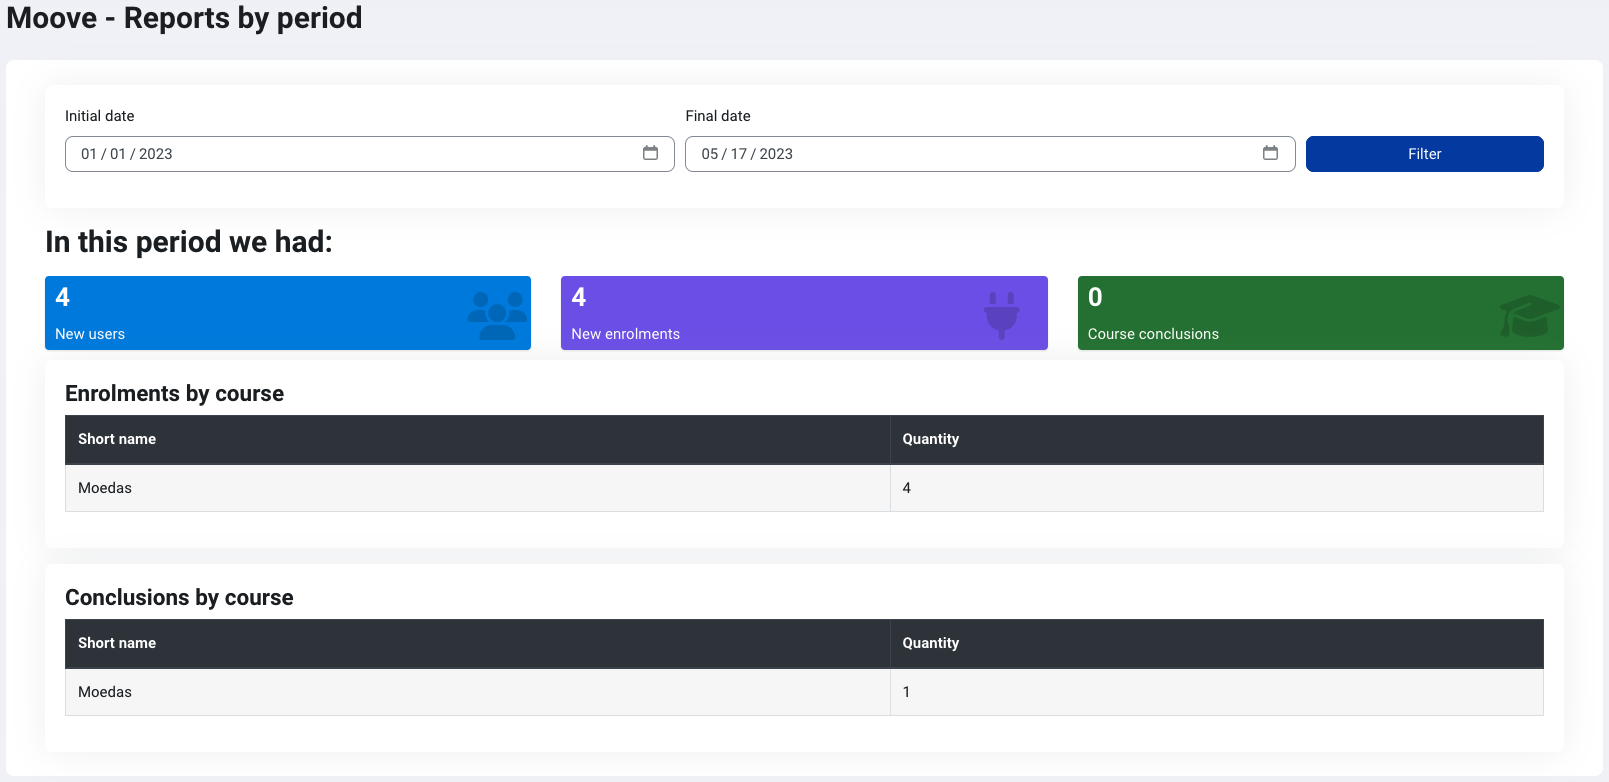
In this report, you can make filters on a time period to view data related to new users, new enrolments, and course completions.
The report also displays two tables with the courses and their new enrolments and completions in the given time period.